
Post updated with info on Richmond home sale

Faithful readers know that the charting of the housing bubble has changed over the course of 2012.
We have seen a dramatic reversal from houses that were selling for hundreds of thousands of dollars over asking price (asking prices which were, of themselves, way over assessed value)... to one where we charted by how much sellers were cutting asking prices (which when cut, were still over assessed value)... to one where properties are listed below assessed value... to where we are now: were we charted the biggest drops below assessed value.
We have seen a dramatic reversal from houses that were selling for hundreds of thousands of dollars over asking price (asking prices which were, of themselves, way over assessed value)... to one where we charted by how much sellers were cutting asking prices (which when cut, were still over assessed value)... to one where properties are listed below assessed value... to where we are now: were we charted the biggest drops below assessed value.
That is a MASSIVE change in the market.
Does it mean the market has crashed? Nope - not yet.
And because it has not 'crashed' yet, many express frustration at where were are.
In many ways it is like watching a pot boil. The over all process is not that long, but because we hang on results every day it seems to take forever.
In many ways it is like watching a pot boil. The over all process is not that long, but because we hang on results every day it seems to take forever.
When we profile properties 40% and 50% below assessed value, some express disappointment that these are properties many would consider a POS.
How quick we are to discount what is happening in the broader market.
Many other properties, like this one at 6139 Dunsmuir Crescent in Richmond, are selling for more than 30% below assessed value.
Many other properties, like this one at 6139 Dunsmuir Crescent in Richmond, are selling for more than 30% below assessed value.
6139 Dunsmuir Crescent is a 5 bedroom, 4 bath 2,,351 sq ft single family house in the prestigious Terra Nova neighbourhood in Richmond.


A newer home, it was assessed in 2011 at $1,470,000.

While on the market this year, the seller dropped the asking price as low as $1,188,888.

6139 Dunsmuir sold last week for $1,060,000... or 27% under assessed value (hat tip to one of the anonymous contributors to the comments section). We have since been advised that the home sold with HST included in the final sale price.
According to the calculator below, this means the house sold for $985,000 (click on image to enlarge):

The end result is that this home actually sold for 32% under assessed value.
We have shown you real estate agents like James Wong who are very honest and upfront about market conditions. They will tell you bluntly - if you aren't listing for at least 10-15% below assessed value right now, no one is looking at your home.
According to the calculator below, this means the house sold for $985,000 (click on image to enlarge):
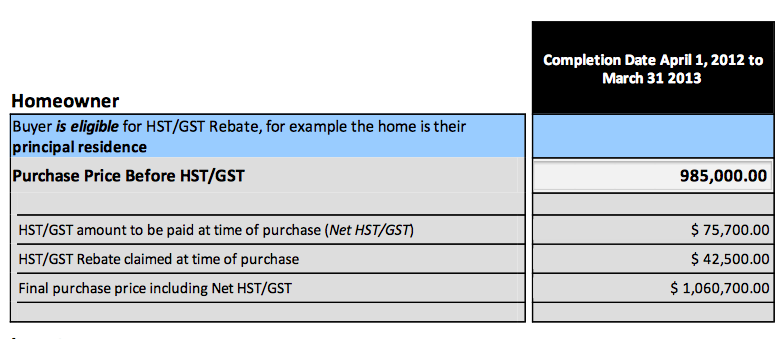
The end result is that this home actually sold for 32% under assessed value.
We have shown you real estate agents like James Wong who are very honest and upfront about market conditions. They will tell you bluntly - if you aren't listing for at least 10-15% below assessed value right now, no one is looking at your home.
As this example shows you, brand new homes in Richmond are selling for more than 30% below assessed value. This is a stunning sea-change from the start of 2012.
Let's look at another set of statistics to put things into context.
The peak for the industry's franken average HPI (Home Price Index) for single family homes on the westside of Vancouver occurred in April 2012. At that time the HPI was $2,268,500.
Last month (at the end of November 2012) that number had fallen to $2,029,300.
You may glaze over at those numbers - or dismiss them as still wildly insane - but that's a drop of $239,300 in 7 months.
Single family houses on the west side of Vancouver are losing value at the rate of $34,186 per month!
Or phrased another way... $1,140 per day!
Or phrased another way... $1,140 per day!
(hat tip VMD @ VCI).
The unwinding of a bubble takes a long time to play out. In the United States things started to drop in late 2005/early 2006, but the collapse of the housing market really didn't enter our consciousness until 2008.
We are only in the early stages here... but the early stages have already produced some dramatic results. If those dramatic results continue into the Spring, the next phase of the collapse will kick into gear.
==================

Click 'comments' below to contribute to this post.
Please read disclaimer at bottom of blog.


![[Most Recent Quotes from www.kitco.com]](http://www.kitconet.com/charts/metals/gold/t24_au_en_usoz_2.gif)
![[Most Recent Quotes from www.kitco.com]](http://www.kitconet.com/charts/metals/silver/t24_ag_en_usoz_2.gif)
![[Most Recent Quotes from www.kitco.com]](http://www.weblinks247.com/indexes/idx24_usd_en_2.gif)


