

If you click on the above image, you can enlarge it.
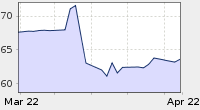
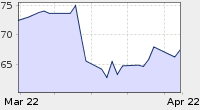
The chart is Vancouver's average real estate sale prices. The upper line represents detached houses and is significant this month because the Village on the Edge of the Rainforest has hit a new high for average detached house price: $1,144,537.
It's a stunning number to be sure.
Back in the fall of 2009, when prices had started to climb again after a temporary adjustment in response to the 2008 financial crisis, there was considerable dismay in the Bear camp because it appeared that the 'Stages of a Bubble' pattern appeared to be wrong this time.
All asset 'Bubbles' follow a very predictable pattern as exemplified by this graph (also click to enlarge):

Many believed the drop in 2009 was a case of our market passing the 'New Paradigm' stage, moving through the 'Denial' stage and into the 'Return to Normal' stage.
Bear despair began to mount when prices continued to climb and new highs once again established.
On various blogs I commented that the Asset Bubble pattern had not been dis-proven... Bears were simply mistaken believing we had reached the 'New Paradigm' stage.
Mortgage rule changes and a stalling economy may produce a slow melt, but it will be rising interest rates that finally prick the bubble.
And that hasn't happened yet.
And as one watches the market lately, it's hard not to find the developments of late to be significant.
The failure of a crash to fully materialize in summer of 2009 has almost emboldened and cemented the belief that it 'truly is different here'.
There is, once again, mania in the industry.
Our friends over at VREAA were moved to comment on this today.
The recent rise in average prices looks almost "vicious". Taking a snapshot of the current condition VREAA notes a milieu of heady prices, breathless media reportage, a disregard for debt by some economists, and nothing less than full on Bull exuberance:
- In pockets of Vancouver, a fair number of over ask sales; Westside, Richmond, and Eastside, too.
Global BC runs a breathless piece on spiking prices, bidding wars, and over ask sales; with the obligatory mention of “increased Asian investment”. [3 Feb 2011, archived by fellow archivist Greenhorn HERE.]
The Vancouver Sun runs an article ‘How much has the value of your Metro Vancouver home increased in five years?‘ [4 Feb 2011].
In a G&M article [3 Feb 2011] Benjamin Tal, CIBC ‘specialist on household credit’, argues that we’re all richer than we think, and that the 148% debt to disposable income ratio is nothing to worry about. An unwise position, in our humble opinion, and one that is likely to haunt Tal in the fiasco that will follow.
I would humbly suggest that not only is the Asset Bubble pattern still fully at play but that we are only now moving fully into the Greed/Delusion/New Paradigm stage.
The Irving Housing Blog descibes this aptly:
- In the Greed stage, the bullish sentiment reaches a feverish pitch and prices rise very rapidly. Every owner in the market is making money and most believe it will go on forever. As prices continue to climb, buyers become very enthusiastic about owning the asset, and they tell all their friends about their great investment. The word-of-mouth awareness and increased media coverage bring even more buyers to the market. Egomania sets in as everyone thinks she is a financial genius. Any intellectual analysis at this stage is merely a cover for emotional buying and greed. During the Great Housing Bubble, there were many instances of properties receiving a dozen or more offers the day they were listed, with many in excess of the asking price.
As some Bears fretted in autumn 2009/Spring 2010, I suggested that we needed to sit back and allow events to play out.
The Asset Bubble pattern had not been disproven, it simply had not fully played out yet.
Watching events unfold these past two months, I remain fully convinced our real estate market is unfolding in classic Bubble format.
==================
Email: village_whisperer@live.ca
Click 'comments' below to contribute to this post.

![[Most Recent Quotes from www.kitco.com]](https://lh3.googleusercontent.com/blogger_img_proxy/AEn0k_uFGOviopu8M_OFWAfY4R7ke7q-hMHTxLqVIAbyANvBku-iNipnheWGQLvSpW68hElfQm8jtNVlGbhZVbqrgQfT44e4COgRXuL0QOC8YmtonwmoyG-hyb25d6La4P-nHx4bjA=s0-d)
![[Most Recent Quotes from www.kitco.com]](https://lh3.googleusercontent.com/blogger_img_proxy/AEn0k_vx0UUBiICFEDqmDINk56q0HTmjoqD0ON1KAvunfPgy-HsvRIyLMZNAuWf_CFupFlDuteCSilVIJuDN2WAxONkt9nPw9UdC0jBNHT4n8DjQdy7l1uzjjlYTb5DlKSZB_X1LAEXv=s0-d)


![[Most Recent Quotes from www.kitco.com]](https://lh3.googleusercontent.com/blogger_img_proxy/AEn0k_u2-9xYNx8eq5LGrPGZp8elND9g5Vb0sZxB8Ci8QzkCxnJcT8GM1JXTKYzSgZ9EC2VBB1fu2xYSmsRAG4tUSCexaWzFofG6DCvJloWYALmE76w0N0PL-eTG=s0-d)
It is patently obvious that a correction will come with rising interest rates, and I will be glad to see the downfall of realtors etc although it will probably be mine too. However, I take issue with your graph and all such graphs. Nothing is proved or disproved until you can use it to make predictions. To do that you (as someone who proposes the theory) need to put a time scale on it otherwise it is too self similar (ie you can't tell which of your cutely named zones you're in, as you sort of admit). On a tangent (ha ha), same goes for the market 'support' which can be anything you choose, depending on your tendency from bull to bear, depending on where you start to measure and which trough you believe to be the true one.
ReplyDeleteSO. What's your time scale on this? and why? (let's just let go of the support thing, it's X's word against Y's)
Anonymous,
ReplyDeleteThe rationale is that because it's not affordable to the groups of people it needs to be to support it. Anything can happen in the short term, it's less about logic and more about emotion and inertia, but long term always reverts to economic fundamentals. A million bucks for a typical home is insane and everyone knows it. The only reason they're buying whatever they can lever up to is to gamble on future increase --- that'll end one day, and the reckoning will come. In my opinion, it's a false argument to detract with a question of when will it happen..who knows. But let's talk turkey, how many people do you really know who can afford even $500k for a home with being totally stretched? Hardly any is the reality - and the answer to that question is why the GVRD is ripe for a reset.
Best
CanAmerican
great post again whisperer,
ReplyDeletehere is a video on the US debt problem and how it cannot be fixed.
bonds are the key
You will notice that I didn't say any different than you. Your argument in the comment makes perfect sense, and I agree 100% that this is what will happen, for the reasons you state in the comment. BUT the graph doesn't do much to support it (ha ha again) or to detract from it. And this is because it has no predictive power on 'when' or 'how much' (there are better measures of market fundamentals than locating two arbitrary 'minima' of a non differentiable function and drawing a line through them. But you probably know them and have written about them somewhere already).
ReplyDeleteCeterum censeo Carthaginem esse delendam.